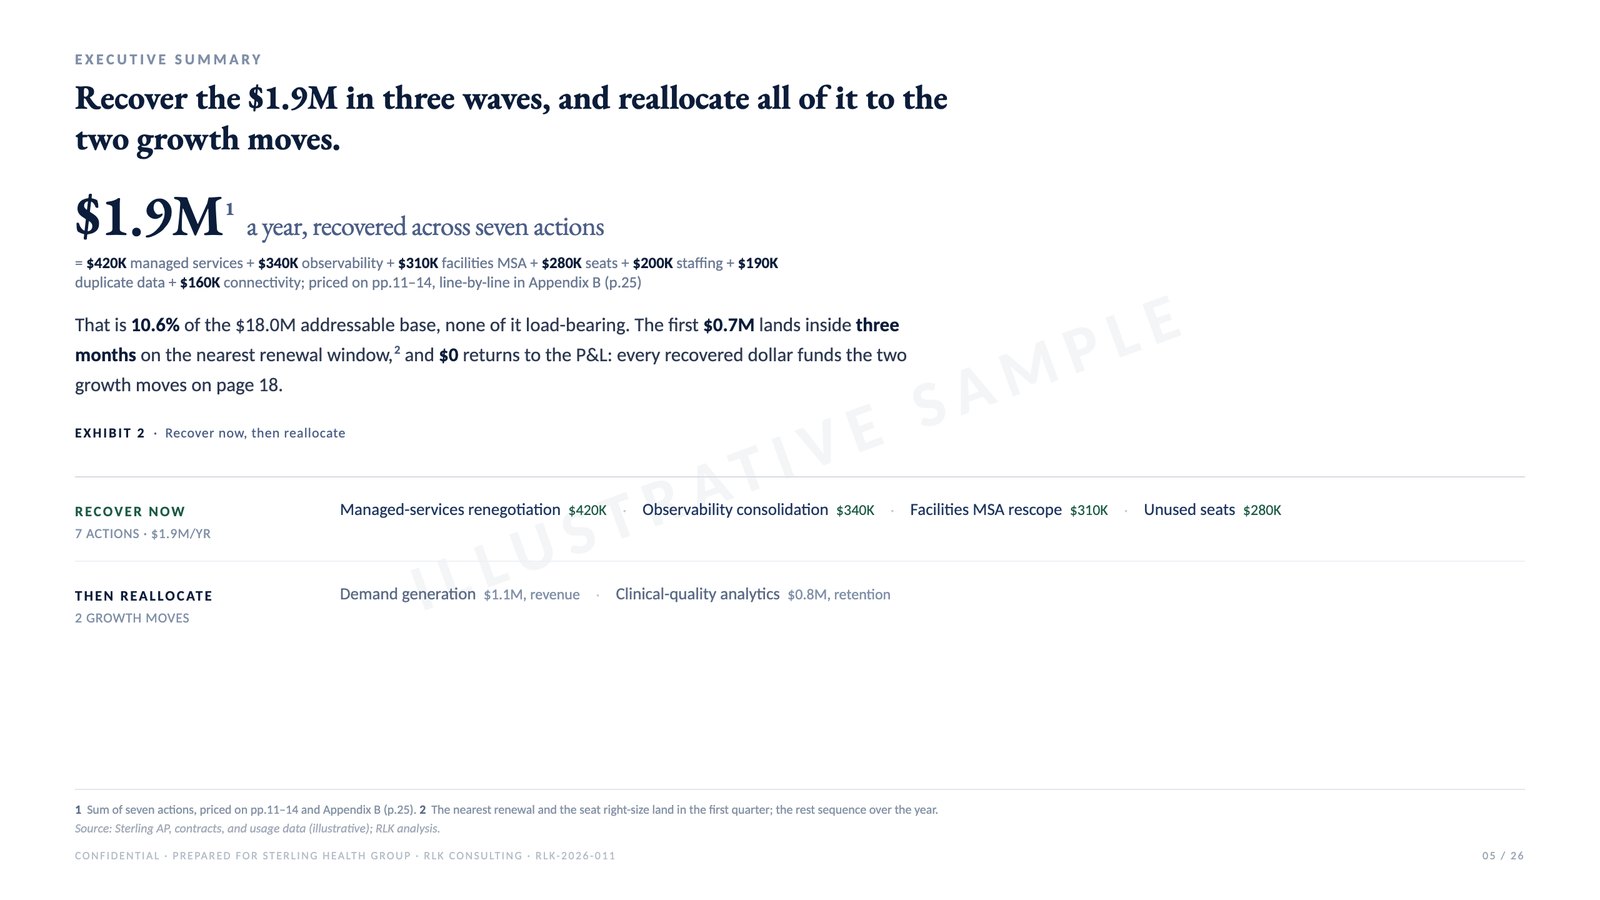
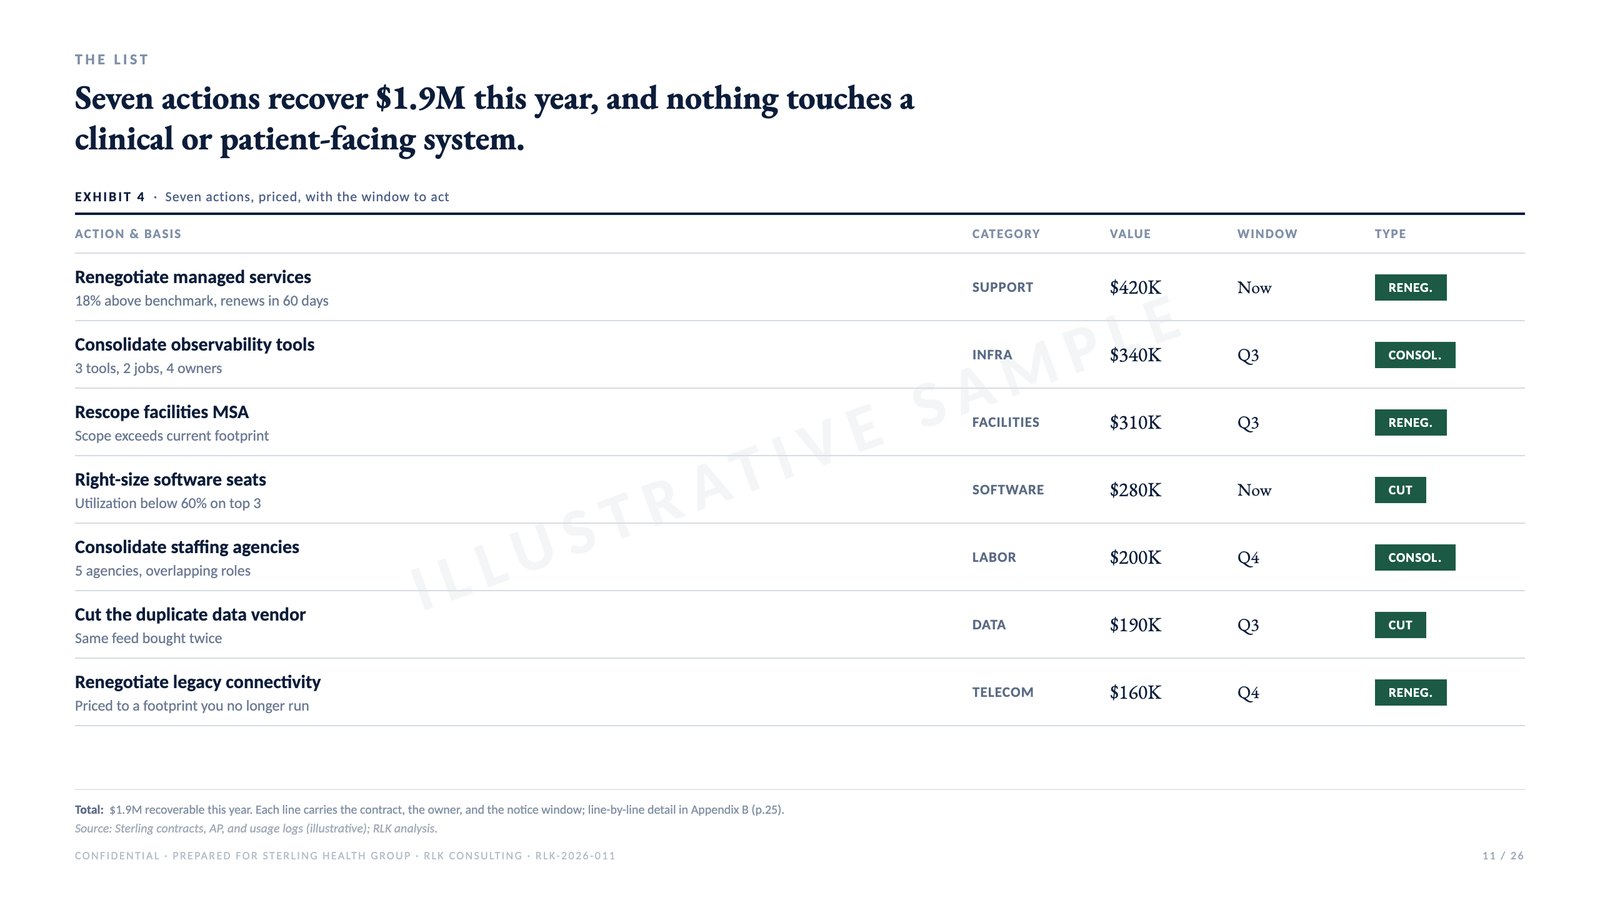
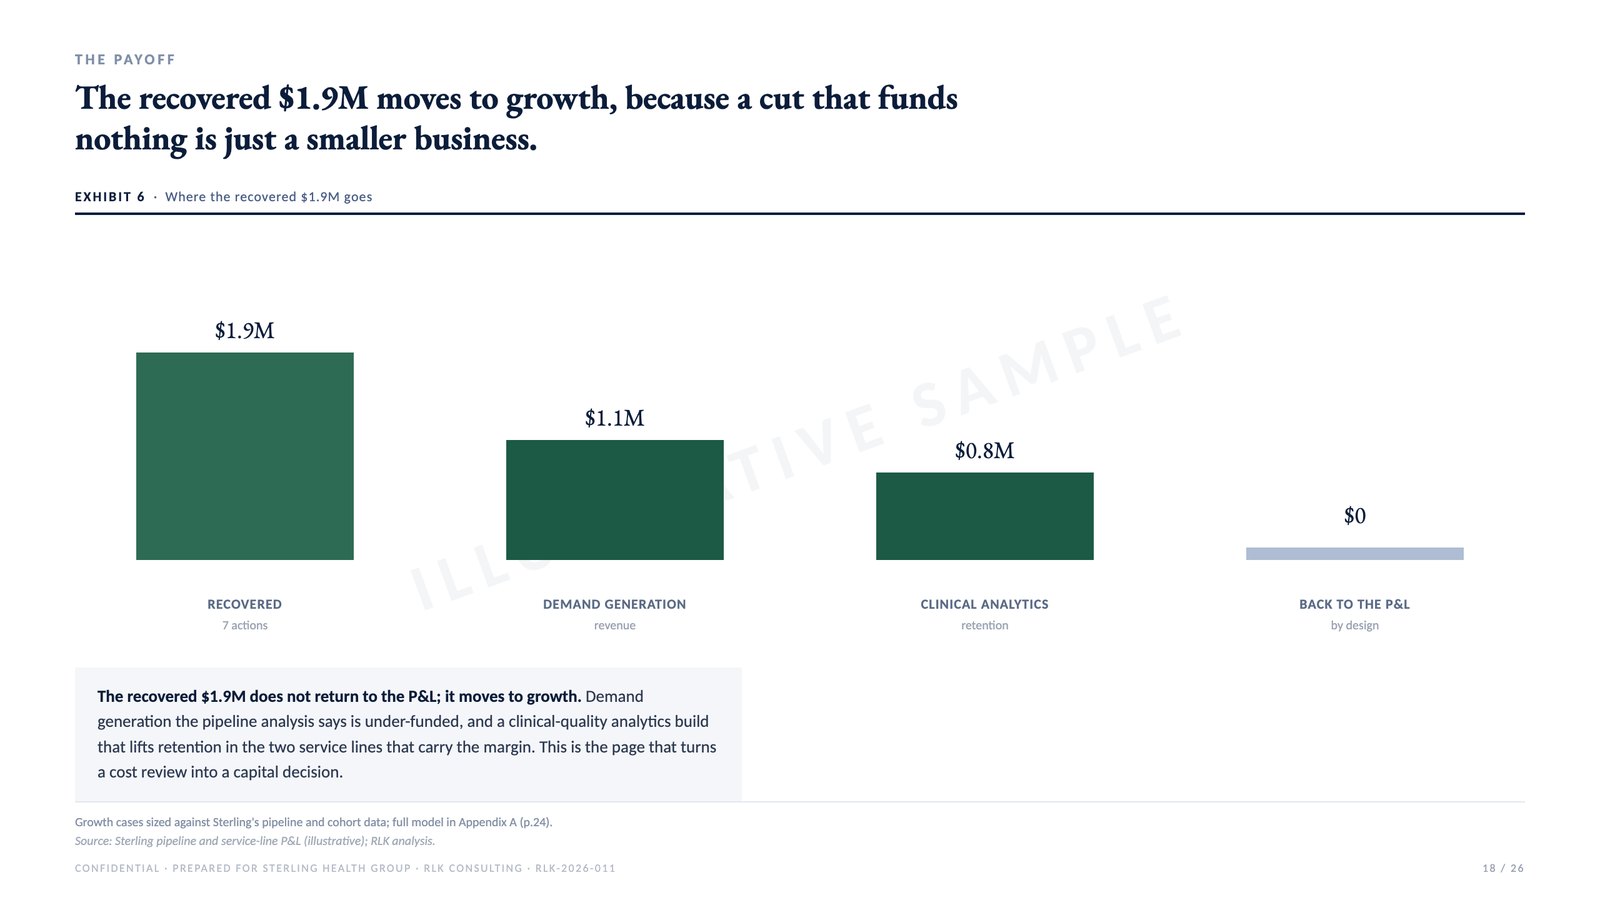
of addressable spend, the share most likely recoverable
Who typically buys this.
Four typical buyers. The door is wider than the list.
The CFO staring at renewalsThe contracts auto-renew, the stack grew with the company, and nobody owns the total.
The CEO funding growth from wasteThe next initiative needs budget, and part of it is hiding in the current spend.
The buyer after the closeThe deal closed with two of everything. Integration needs a ranked list of what stays.
The operator who inherited the stackEvery tool had a reason once. Get the list of which reasons still hold.
You get five things back.
The spend mapOne page that shows the full addressable spend, broken into the categories where action is recommended, where the picture is fine, and where there is not enough data to act yet.
Ranked recommendationsEach action carries the current annualized cost, the recommended move of cut, consolidate, renegotiate, or leave alone, plus the dollar impact, the effort, and the named owner.
The market-price checkHow your vendor spend compares to what companies your size and sector pay for the same categories. The benchmark turns the conversation from whether a contract looks expensive to whether it actually is.
The reallocation thesisWhere the saved dollars should go, with the growth math under each move. This is the page that turns the conversation from cost cutting toward capital reallocation.
Renegotiation playbookTalking points and walk-away positions for the three to five upcoming renewals that matter most. Written so your procurement lead can carry it into the room.
You send five things.
The spend, line by lineYour vendor and technology spend for the last two years, contracts included, so nothing hides in a renewal you forgot you signed.
Contracts and renewal datesTerms, auto-renewals, and notice windows, so savings are timed to when you can actually act on them.
What each vendor is really forThe job each contract is meant to do and who depends on it, so cuts land on waste, not on something load-bearing.
Usage and overlapSeat counts, utilization, and the tools that quietly do the same job, where the fastest savings usually sit.
Where the freed budget should goThe growth priorities the savings should fund, so this reads as a reallocation, not just a cut.
Illustrative sample. Sterling Health Group is a fictional company and every figure is dummy data. Full example deliverables are available upon request.
See where your spend stops earning its cost.
Three to four weeks, a priced map of what to renegotiate, consolidate, or cut, and a thesis for where the recovered capital should go. It starts with a free 30-minute call.